
Country Travel Tracker
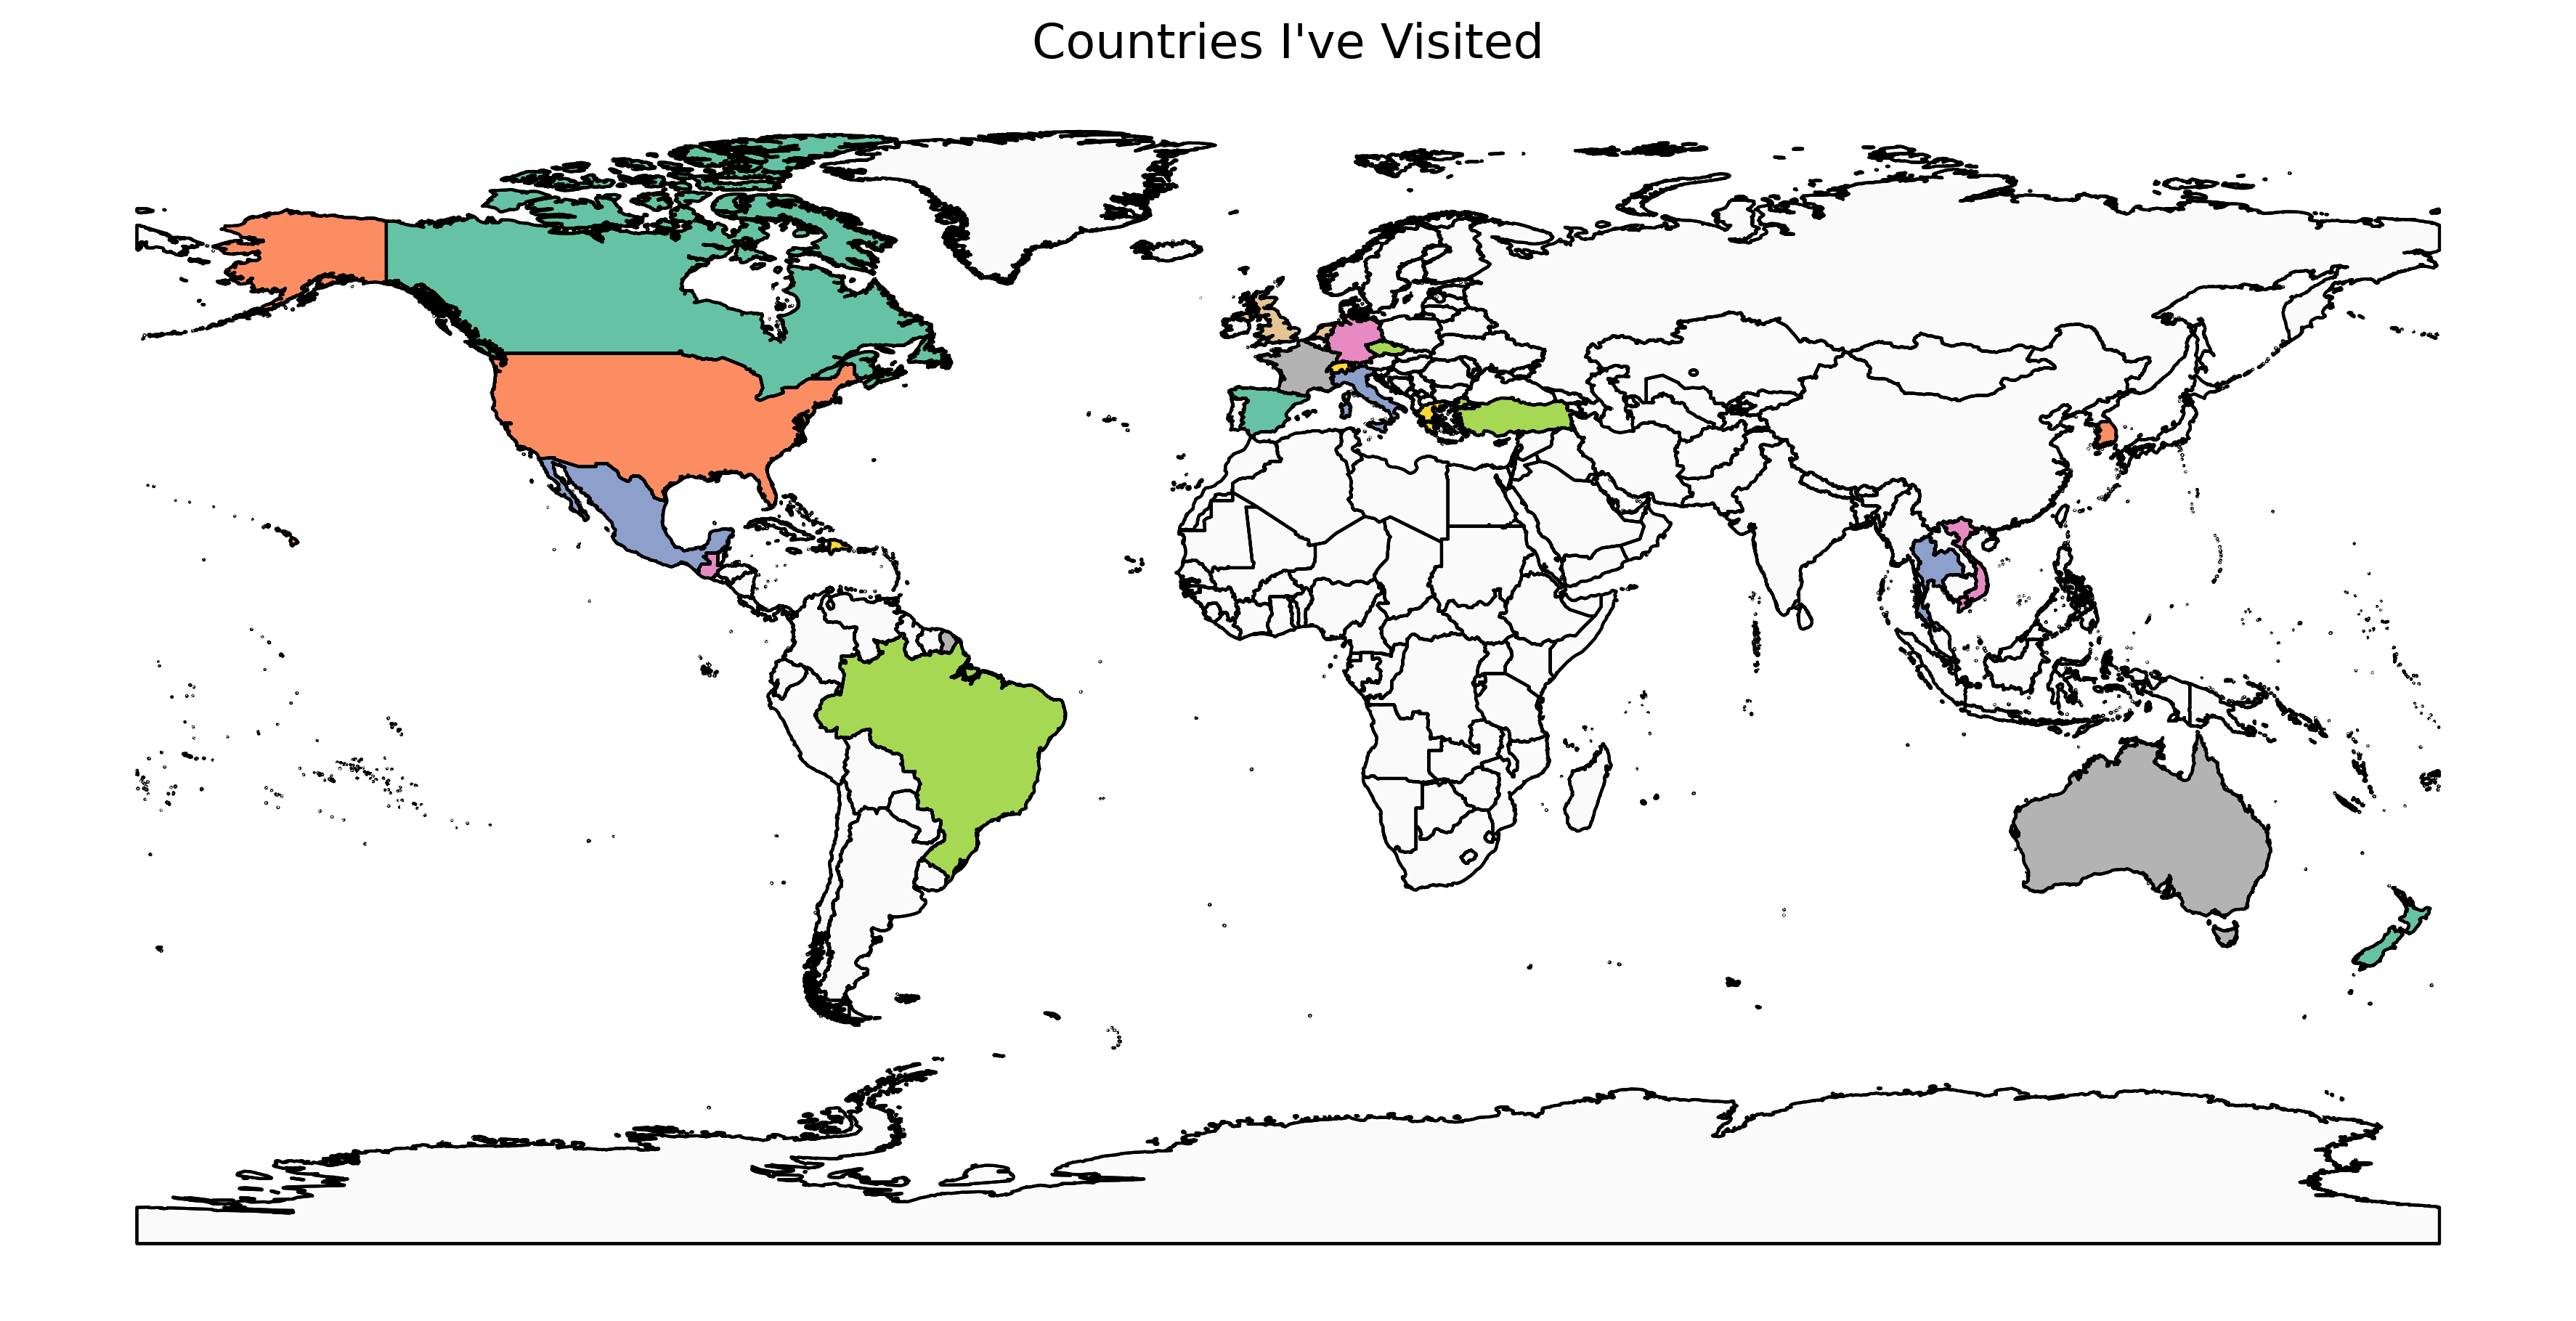
These are the countries I’ve travelled to so far! This script (bottom of page) lets me add a country code, and it’ll update this page :).
Count = 23 (As of 2024-09-12)
🇨🇦 Canada
🇺🇸 United States
🇲🇽 Mexico
🇬🇹 Guatemala
🇧🇷 Brazil
🇩🇴 Dominican Republic
🇬🇧 United Kingdom
🇫🇷 France
🇪🇸 Spain
🇲🇨 Monaco
🇮🇹 Italy
🇩🇪 Germany
🇨🇿 Czechia
🇨🇭 Switzerland
🇳🇱 Netherlands
🇦🇺 Australia
🇳🇿 New Zealand
🇰🇷 Korea, Republic of
🇹🇭 Thailand
🇻🇳 Viet Nam
🇹🇷 Türkiye
🇬🇷 Greece
🇻🇦 Holy See (Vatican City State)
Python Visualization Script
The following script is how I generated the image above from country codes.
import os
import random

import geopandas as gpd
import matplotlib.pyplot as plt
import seaborn as sns

# Path to your local shapefile
shapefile_path = "./ne_10m_admin_0_countries/ne_10m_admin_0_countries.shp"

# Load the local shapefile
world = gpd.read_file(shapefile_path)

# List of visited countries (ISO 3166-1 alpha-3 country codes)
visited_countries = [
    "CAN",
    "USA",
    "MEX",
    "GTM",
    "BRA",
    "DOM",
    "GBR",
    "FRA",
    "ESP",
    "MCO",
    "ITA",
    "DEU",
    "CZE",
    "AUS",
    "NZL",
    "KOR",
    "THA",
    "VNM",
    "TUR",
    "GRC",
    "VAT",
]

# Create a new column 'visited' to mark visited countries
world["visited"] = world["ADM0_A3"].apply(
    lambda x: "Visited" if x in visited_countries else "Not Visited"
)

# Create a unique color for each visited country
# Get a seaborn palette with enough colors for the visited countries
palette = sns.color_palette("Set2", len(visited_countries))

# Assign each visited country a color from the palette
visited_colors = {country: palette[i] for i, country in enumerate(visited_countries)}

# Create a new column to assign colors to visited countries
world["color"] = world["ADM0_A3"].apply(
    lambda x: visited_colors.get(x, "#fafafa")
)  # Default non-visited countries to gray

# Plot the map
fig, ax = plt.subplots(1, 1, figsize=(15, 10))

# Plot country borders
world.boundary.plot(ax=ax, linewidth=1, color="black")

# Plot visited countries with their assigned colors
world.plot(ax=ax, color=world["color"], edgecolor="black", legend=True)

# Add title
ax.set_title("Countries I've Visited", fontsize=16)
ax.axis("off")

output_image_path = (
    "assets/images/2024-09-05-countries-i-ve-travelled-to/visited_countries.png"
)
# Save the map as a PNG file
plt.savefig(
    os.path.join("../", output_image_path),
    bbox_inches="tight",
    dpi=300,
)


Comments